In recent years, technical analysis in Forex market has gained a lot of popularity and has been in constant development due to the advancement of technologies. Definitely, this is one of the first topics where newcomers to the market start, because its simplicity. The success of this is essentially due the fact that it can be applied to all assets, in any time interval and without great economics knowledge.
Combined with fundamental analysis it is one of the two main ways to analyze the market. Meanwhile the fundamental is an analysis of causes and uses mainly macroeconomic indicators, the technical is an analysis of consequences and focuses on the study of prices. Due these reasons and others that we will explain later, most traders today try to have at least notions of technical analysis. This article, is a brief introduction to technical analysis in the Forex market, in which we will see the meaning, basic principles and the most used tools.
What is Technical Analysis?
Technical analysis is based on the study of price action to predict future market movements. For this, it relies on indicators and graphs based on the historical data of the assets. Its three main sources of information are: Price, Volume and Open Interest. In addition to predicting future trends, it also allows us to make other types of decisions, such as choosing the best time to enter and exit a trade.
The analysis of the behavior of prices has been studied for centuries, examples of which exist both in Europe and Japan, although the general consensus is that the father of what is known today as technical analysis, was the North American Charles H. Dow at the end of the 19th century. He created both the Dow Jones index and the Dow Theory, these have been so popular that many traders and analysts still use them on a daily basis today.
Basic premises of technical analysis
Technical analysis is based on three basic premises:
- The price discounts everything
- Prices move by trends
- History repeats itself
The price discounts everything
According to technical analysts, all the information is included in the price. This principle can be considered the main one of technical analysis and means that any element that affects the market, whether of a political, economic or social nature, is reflected in the price. The graphs do not move by themselves, but the fundamental factors and the balance between supply and demand cause the movements.
Prices move by trends
This premise is based on the greater probability that a current trend will continue in the same direction as it will recede. Consequently, one of the goals of technical analysis is to identify trends in their early stages and operate in the direction of the trend as a rule. These trends can have three directions: bullish (uptrend), bearish (downtrend) or sideways (horizontal trend).
Always remember: The trend is your friend.
History repeats itself
A large part of technical analysis has to do with human psychology. Human beings tend to react in the same way to similar circumstances. Therefore, it is very likely that figures and patterns that behaved in a certain way in the past, can help to predict future movements in the market. That is why it is said that the market has memory.
“Study the past if you would define the future”
Confucius
Technical analysis tools
Technical analysis can be divided into two main aspects by the characteristics of the tools used: Graphical or Chart Analysis and Quantitative or Mathematical Analysis. It is made up of a wide diversity of tools that are increased every year with new tools or new approaches thanks to the advancement of technologies.
Graphical analysis
The Graphical Analysis or Chartist includes the tools that are applied directly to the price chart. Among the main ones are:
Drawing tools
Drawing tools are lines that are drawn on graphics. The best known are supports, resistances, trend lines and channels.
Supports and resistances
The function of these tools is to show the points where the price of a security is at a possible maximum or minimum and they exist as a product of supply and demand. These levels coincide with previous lows and highs on the chart and the price usually reacts to them with more or less intensity.
A support is a price level below the current one where the bearish momentum could weaken to rise again and coincides with significant lows previously reached on the chart. The expectation is the buying force exceed the selling force.
A resistance is the opposite of a support. It is a price level above the current one, and in which the upward momentum could weaken to begin its decline. It coincides with significant highs previously reached, and the sales force is expected to outperform the buying force.
Many operators often use these tools to set limits on their operations; once a resistance is reached, it becomes support and the same happens the other way around. Both levels will be stronger, while more times the market has tested them. In case of any of these marks breaks we can expect the price continue trending. A support or resistance that has been in place for longer, is considered stronger than one that has formed recently.
Trend Lines
Financial markets generally move by trends, therefore the first thing to analyze for a trader should be the trend lines. To draw an ascending trend line, two or more lows are joined, and for a descending trend line, two or more highs are joined.
The more times a trend line has been tested, more important it is.
Usually the price goes back to a trend line before continuing in the same direction. On the other hand, when the price breaks the trend line it may mean that it is over, but it is something that will need to be confirmed in some way. This could be done with the daily close or with a certain percentage away from the trend line.
Trends can be classified into three types:
- Uptrends
- Downtrends
- Sideways trends (Prices move in range)
Channels
A channel is an area of the price chart bounded by two lines, the main trend line and a parallel line. In other words, prices move within a channel determined by the highs and lows. Apart from giving us the range of action where the market moves, many use them to determine levels of profit or loss. Like trends, channels can be classified as upward, downward and sideways.
Technical patterns
Patterns are formations that often appear on stock charts and define current market conditions and possible future behavior. Unlike candlestick patterns that are formed in a short period of time, most chart patterns take longer to develop. There are two types of patterns: trend reversal and continuation. Among the best known are the following:
Trend reversal
- Shoulder-head-shoulder
- Inverted shoulder-head-shoulder
- Double top or double bottom
- Triple top or triple bottom
- Rounding top or rounding bottom.
Continuation
- Triangles: ascending, descending and symmetrical
- Flags and pennants
- Wedges
Japanese Candlestick Patterns
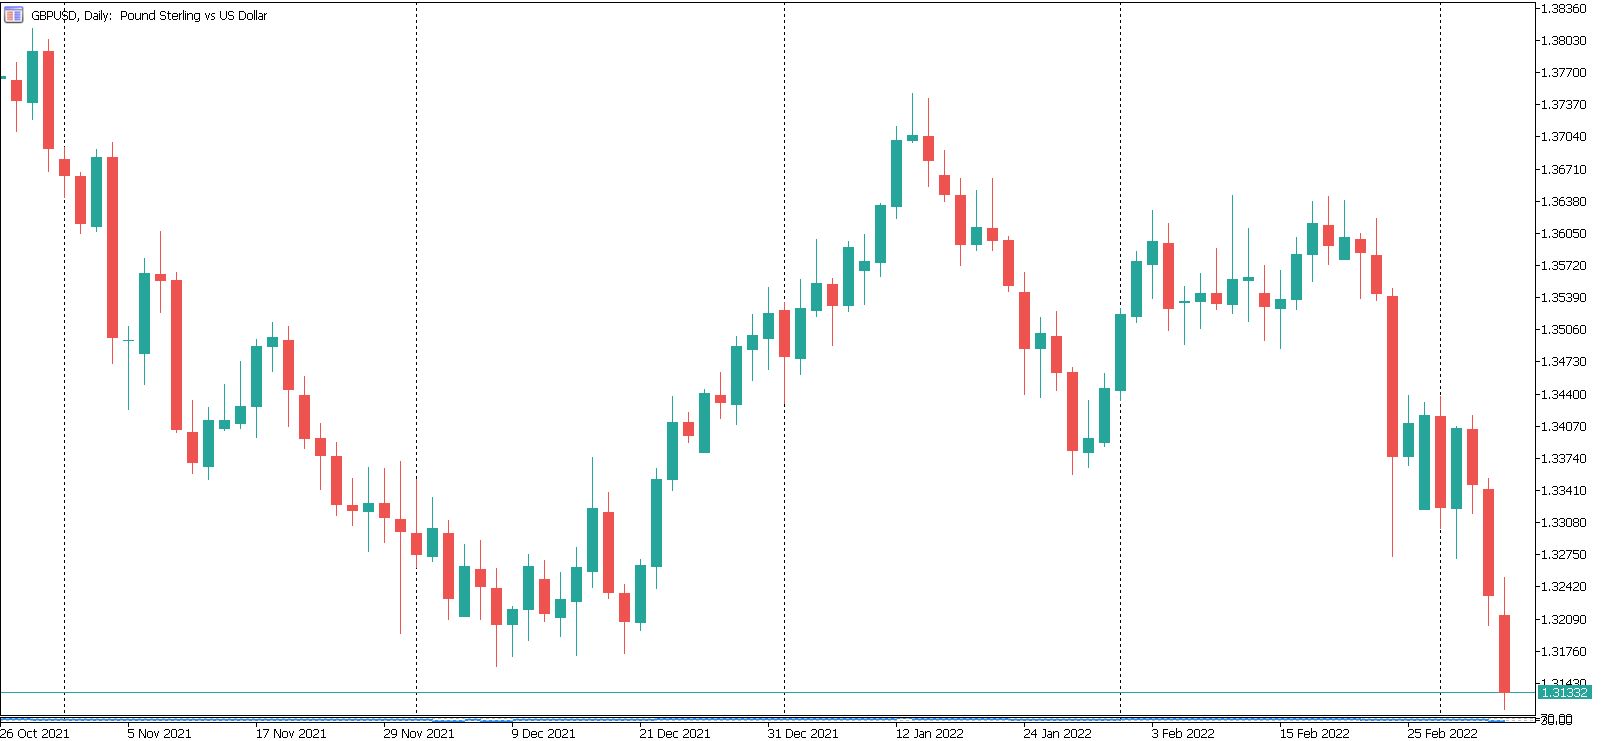
Japanese candles or candlesticks are a graphic representation of the market price in a given period of time and offer us more information than bar and line charts. Each candle shows us the opening, closing, high and low data. Mostly they are important in the formation of patterns of one or more candles that help to predict the sentiment and behavior of the market.
Japanese candlestick patterns were already used in 19th century Japan and are one of the most widely used tools in today’s technical analysis. This analysis can be used in any market and combined with any other tool. Candlestick patterns are bullish, bearish, or neutral.
Quantitative analysis
Besides the graph, the other branch of technical analysis is quantitative, which is based on mathematical and statistical models. The advantage of this analysis is the elimination of the subjectivity of the graph analysis. Generally, these models are represented in technical indicators that help us to calculate the direction of the trend and the strength of the market. They are also used for the generation of buy / sell signals and to find divergences with the price; for this they mainly use price and volume data. Among the most used are Moving Averages, RSI, Stochastic and MACD. There are a large number of them and they can be divided into 5 categories:
Trend following indicators
They are very versatile and popular technical indicators. As the name suggests, they are used to determine and follow the direction of trends. They are very useful lagging indicators in markets with defined trends, but they tend to give multiple false signals at times of lateral or undefined trend. In these cases, oscillator signals are preferable. The main indicators included in this category are:
- Moving Averages (Simple, Exponential, Weighted)
- Bollinger Bands
Oscillators
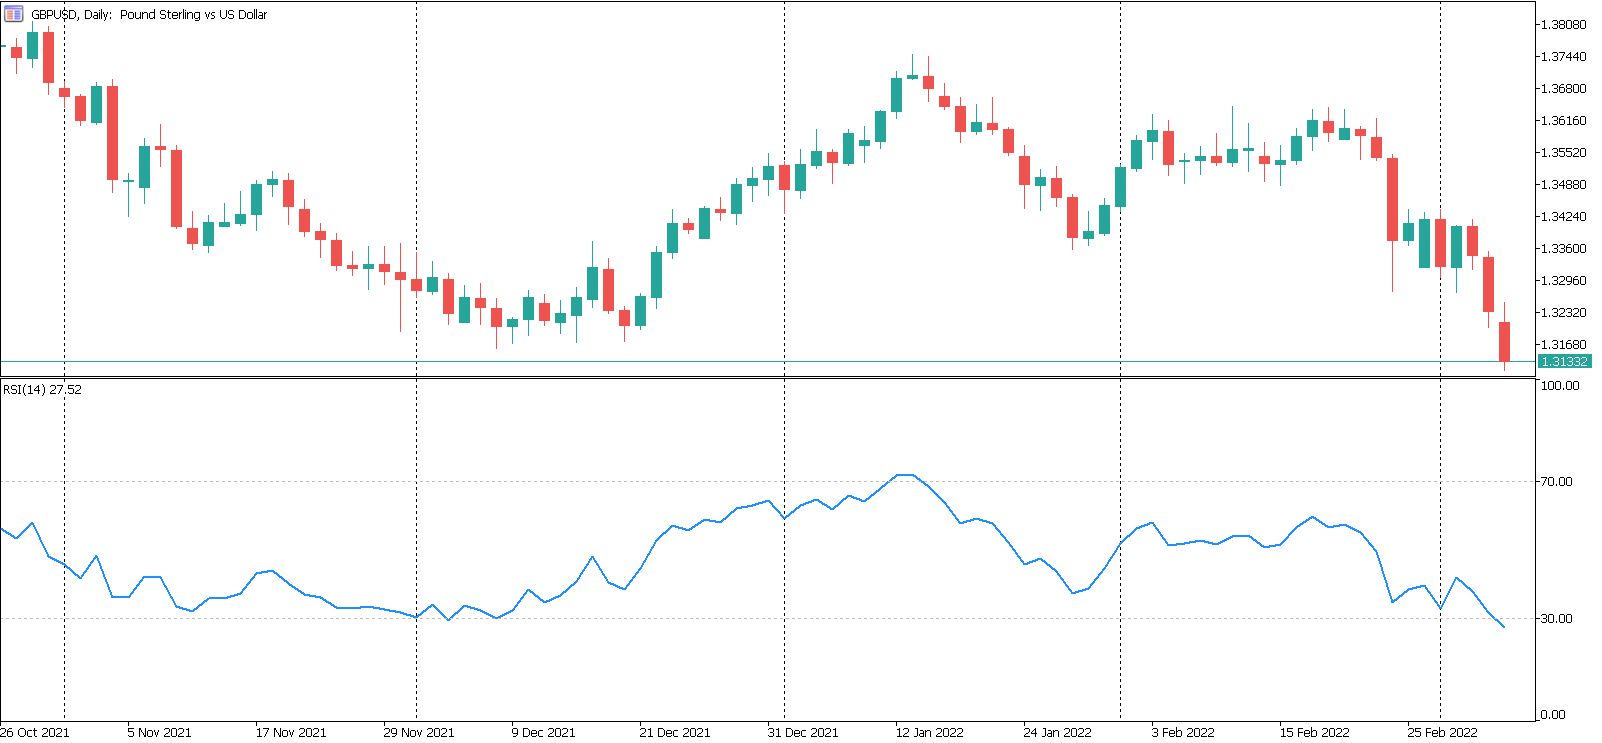
Oscillators are computer-based mathematical models applied to price and usually represented on separate graphs. They serve mainly to measure the strength or weakness of an asset. They are leading indicators that work best in markets without a defined trend when moving averages or other trend-following studies do not provide good signals.
Among other utilities, they help us to predict a possible price reversal, identifying extreme overbought or oversold conditions in the markets and also showing divergences in relation to the asset price. They are usually plotted as lines or histograms. Among the best known are:
- RSI (Relative Strength Index)
- Stochastic Oscillator
- CCI (Commodity Channel Index)
- MACD (Moving Average Convergence / Divergence)
- Williams% R indicator.
- Momentum
- Force Index
Volatility indicators
Volatility indicators measure how quickly the price of an asset changes. The higher the volatility, there could be greater opportunities for profit but also for losses. With these indicators we can find the required balance.
- Bollinger Bands
- ATR (Average True Rank)
Trend strength indicators
They do not provide information about the direction, only if the asset is in the trend phase, the strength of the trend and the probabilities that this phase will continue.
- ADX (Average Directional Index)
- VHF (Vertical Horizontal Filter)
Volume indicators
They allow a study of the volume and its possible implications in price formation. Their study helps to confirm the direction of the price. Due to the decentralized market characteristic, they are not widely used in FOREX.
- Accumulation / Distribution
- Money Flow Index
- On Balance Volume
- Volume Oscillator
Criticisms of technical analysis
There are several criticisms of technical analysis, including the efficient market hypothesis and the random walk theory. Some say that prices cannot be predicted through technical analysis and others even say that it is not possible by any method. Mainly because it is based on past data and that is not a guarantee of similar behavior in the future. Unquestionably, there will always be the possibility of some unpredictable elements for any theory or analysis.
Advantages of technical analysis
For many years technical analysis has been widely used by analysts and among the many advantages attributed to it we have:
- High knowledge of economics is not required.
- All the factors that affect market prices are reflected in the price.
- Can be used with any financial instrument.
- It can be used on several instruments at the same time.
- Works in any time frame.
- Allows you to locate entry and exit points in the market.
Conclusions – Technical analysis in Forex market
Over the years, technical analysis has proven to be a useful and simple tool for predicting market movements. There are examples of successful traders with both fundamental and technical analysis; however, many successful traders often combine both, technical and fundamental approaches. It is true that technical analysis is based on probabilities and has limited predictive power, mainly because historical price information is sometimes insufficient to predict future price. In contrast, in very short-term operations, when there is no time for in-depth fundamental analysis, technical tools certainly make the job easier. A very different case is for traders who hold their positions for long periods of time.
Anyway, technical analysis has many followers among analysts and traders. Some attribute to this popularity the fulfillment of its patterns and rules as a consequence of the large number of followers doing the same. There are many technical indicators, but using several at the same time will ultimately result in mixed signals. It is best to choose a few, those that best suit the strategy chosen by the operator. So you can analyze all the information and make the best decision quickly and clearly.
One last tip: sometimes the simplest method can turn out the most effective, especially with proper monetary and risk management.
- What is FOREX?Do you want to know what Forex is? An approach to the subject with detailed and useful information on its operation and main characteristics.
- Types of brokersThere are several types of Forex brokers and learning about them can have a huge impact on your Forex trading experience.
- 10 Basic Forex Terms We Should Know.There are certain basic Forex terms that we must know before operating in the markets and thus have a greater chance of success.
- How to choose a Forex broker?In this article we will show you how to choose a Forex broker, but not just any one, but one that suits your needs.
- Regulation in the Forex marketRegulation in the Forex market is one of the main criteria that must be analyzed before choosing a broker.